
Beyond the Walk Score: Presenting True Pedestrian Context in Real Estate
Learn how to communicate authentic neighborhood walkability to buyers using spatial storytelling, routes, and interactive 3D context instead of relying on a single generic score.

For years, real estate listings have relied on a single, algorithmically generated number to summarize how walkable a neighborhood is. While a high score looks great on a flyer, it rarely tells the whole story of what it actually feels like to walk those streets. A number cannot show the steepness of a hill, the presence of a wide shaded sidewalk, or the barrier posed by a six-lane arterial road. For modern buyers, understanding walkability requires a shift from abstract metrics to lived spatial context, showing them exactly how they will navigate their new environment on foot.

The Limits of Single-Number Walkability Metrics
Walkability has become a major selling point in modern real estate, with buyers actively seeking neighborhoods where they can reduce car dependency. To satisfy this demand, many platforms display a single, automated score calculated by algorithms that measure straight-line distance to nearby amenities. While this metric provides a quick baseline, it fails to capture the actual human experience of walking. A high score might suggest a pedestrian paradise, but the reality on the ground can be vastly different.
Algorithms struggle to account for the qualitative aspects of a walk. They do not know if a sidewalk is wide enough for a stroller, if the street is well-lit at night, or if a major intersection lacks a pedestrian signal. By reducing an entire neighborhood to a single number, real estate listings risk misrepresenting the location. This can lead to disappointment for buyers who discover that their supposedly walkable new home is isolated by hostile infrastructure.
Mapping the Pedestrian Experience: Routes and Barriers
To truly explain walkability, real estate professionals must focus on actual routes rather than simple proximity. A park that is physically close to a home might be separated by a busy four-lane highway or a railway line with no nearby pedestrian crossing. In these cases, a short walk becomes a long, dangerous detour. Identifying these physical barriers is crucial for setting accurate expectations.
Highlighting safe pedestrian corridors, underpasses, and overpasses helps buyers understand how they can safely navigate these barriers. Instead of assuming a buyer will figure out the route on their own, presenting a clear, visual path shows that the neighborhood has been thoughtfully evaluated. This level of detail builds trust and demonstrates a deep understanding of the local market.
The Role of Terrain, Shade, and Infrastructure
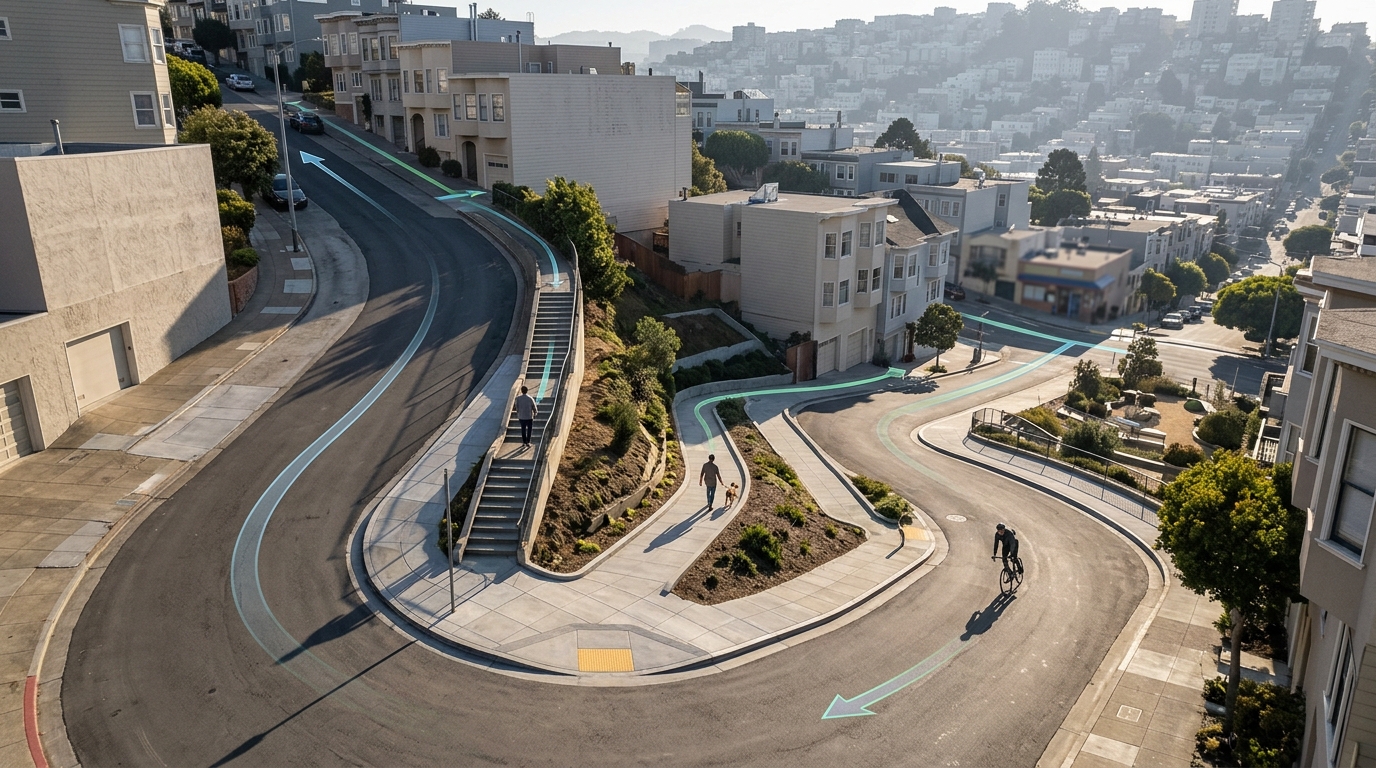
Topography is another critical factor that automated scores routinely ignore. A quarter-mile walk on flat ground is a very different physical experience than a quarter-mile walk up a steep twelve percent grade. For families with young children, elderly residents, or anyone with mobility challenges, terrain can make or break the daily utility of a neighborhood.
Beyond hills, the presence of street trees for shade, well-maintained sidewalks, and curb ramps significantly impacts walkability. A route shaded by a mature tree canopy is highly desirable, especially in warmer climates, turning a mundane chore into an enjoyable stroll. Documenting these physical infrastructure details provides a much richer picture of the neighborhood than any generic rating can offer.
Time-of-Day Relevance and Destination Quality
Walkability is not static; it changes throughout the day and night. A street that feels vibrant and safe during morning commuting hours might feel dark and deserted late at night. Similarly, the types of destinations matter. A neighborhood with ten auto repair shops and industrial warehouses might score high on a proximity algorithm, but it offers very different utility than a neighborhood with a grocery store, a library, and a local cafe.
Highlighting the quality and relevance of local destinations helps buyers visualize their actual daily routines. Showing that a route leads to a family-friendly plaza or a bustling commercial district adds immense value to the listing. It shifts the conversation from how many places are nearby to how those places enhance the buyer's quality of life.

Visualizing the Path: Moving Beyond Static Maps
Traditional flat maps are limited in their ability to convey the three-dimensional reality of a neighborhood. They cannot show the height of buildings, the slope of a hill, or the scale of an intersection. This is where advanced geospatial visualization tools become invaluable. By using interactive 3D platforms, real estate professionals can create immersive location stories that let buyers explore the neighborhood virtually.
Unlike physical drone footage, which is limited to a pre-recorded flight path and cannot be easily updated, interactive 3D visualization allows buyers to control their journey. They can fly over the route, examine the surrounding buildings, and understand the spatial relationship between the property and local amenities. This interactive exploration provides a realistic sense of place that static images and simple numbers cannot match.
Structuring the Walkability Narrative for Listings
When writing listing descriptions or creating marketing materials, agents should weave walkability into a cohesive narrative. Instead of listing distances, describe the journey. For example, mention that the local elementary school is reached via a quiet residential street with wide sidewalks, or that the weekend farmers market is a scenic stroll through a historic district.
This narrative approach helps buyers connect emotionally with the neighborhood. It allows them to picture their morning routine, whether that involves walking the dog along a tree-lined path or heading to a nearby transit station. By focusing on the experience, agents can differentiate their listings and attract buyers who value lifestyle and community context.
Verifying and Validating Local Pedestrian Paths
While digital tools and visualizations are incredibly powerful for presenting a neighborhood, they should always be supported by local verification. Real estate professionals should ideally walk the routes themselves or consult local resources to ensure the accuracy of their descriptions. This ground-truth validation ensures that the information provided is both reliable and authentic.
Combining interactive 3D visualization with firsthand local knowledge creates the ultimate neighborhood guide. It shows buyers that the agent is not just relying on automated data, but has taken the time to understand and verify the pedestrian experience. This commitment to accuracy is what sets top-tier real estate marketers apart in a competitive landscape.
| Pedestrian Element | What the Metric Assumes | The Real-World Variable | How to Visualize It |
|---|---|---|---|
| Distance to Park | Straight-line proximity | Major highway barrier | 3D flyover showing pedestrian overpass |
| Sidewalk Quality | Continuous paved paths | Broken asphalt or missing curbs | Interactive street-level view |
| Topography | Flat terrain | Steep twelve percent incline | 3D elevation profile and camera tilt |
| Destination Utility | Active retail mix | Closed storefronts or industrial zones | Curated points of interest labels |
| Safety and Crossings | Standard intersections | Unmarked multi-lane crossings | Highlighted pedestrian corridors |
Steps to Build a Complete Walkability Narrative for a New Listing
- Identify the primary daily destinations within a fifteen-minute radius.
- Walk the physical routes to note sidewalk conditions, shade, and crossing safety.
- Map the exact path using interactive 3D visualization tools to show elevation and barriers.
- Highlight specific local landmarks and qualitative features along the route.
- Provide alternative routes for different weather conditions or mobility needs.
A number can tell you that a coffee shop is a quarter-mile away, but it cannot tell you if that quarter-mile is a pleasant stroll under a canopy of historic oaks or a stressful sprint across a busy highway off-ramp.
FAQ
Why is a high walkability score sometimes misleading for buyers?
A high score is typically based on straight-line distance to amenities, which ignores physical barriers like fences, highways, steep hills, and the actual quality or safety of the sidewalks.
How can real estate agents show walkability to out-of-town buyers?
Agents can use interactive 3D location stories that trace actual walking routes, showing the terrain, street layouts, and proximity to key destinations without requiring physical travel.
What is the difference between physical drone footage and 3D geospatial visualization for showing neighborhoods?
Drone footage is a static, pre-recorded video of a specific flight path, whereas 3D geospatial visualization uses licensed imagery to create an interactive, explorable environment where buyers can control their view.
How do physical barriers impact walkability?
Physical barriers like railways, rivers, or multi-lane highways can turn a short two-hundred-meter straight-line distance into a mile-long detour, making an otherwise close destination inaccessible on foot.
Should real estate listings completely ignore standard walkability scores?
No, standard scores are a helpful starting reference, but they should be supplemented with qualitative descriptions, route maps, and interactive visual context to provide a complete picture.
What features make a walking route appealing beyond just distance?
Appealing routes feature continuous sidewalks, street trees for shade, low traffic speeds, active storefronts, safe pedestrian crossings, and minimal elevation changes.