
How Master-Planned Communities Can Show Future Phases Without Confusing Buyers
Discover how real estate developers use interactive 3D geospatial visualization to clearly communicate master-planned community phases, manage buyer expectations, and maintain compliance.
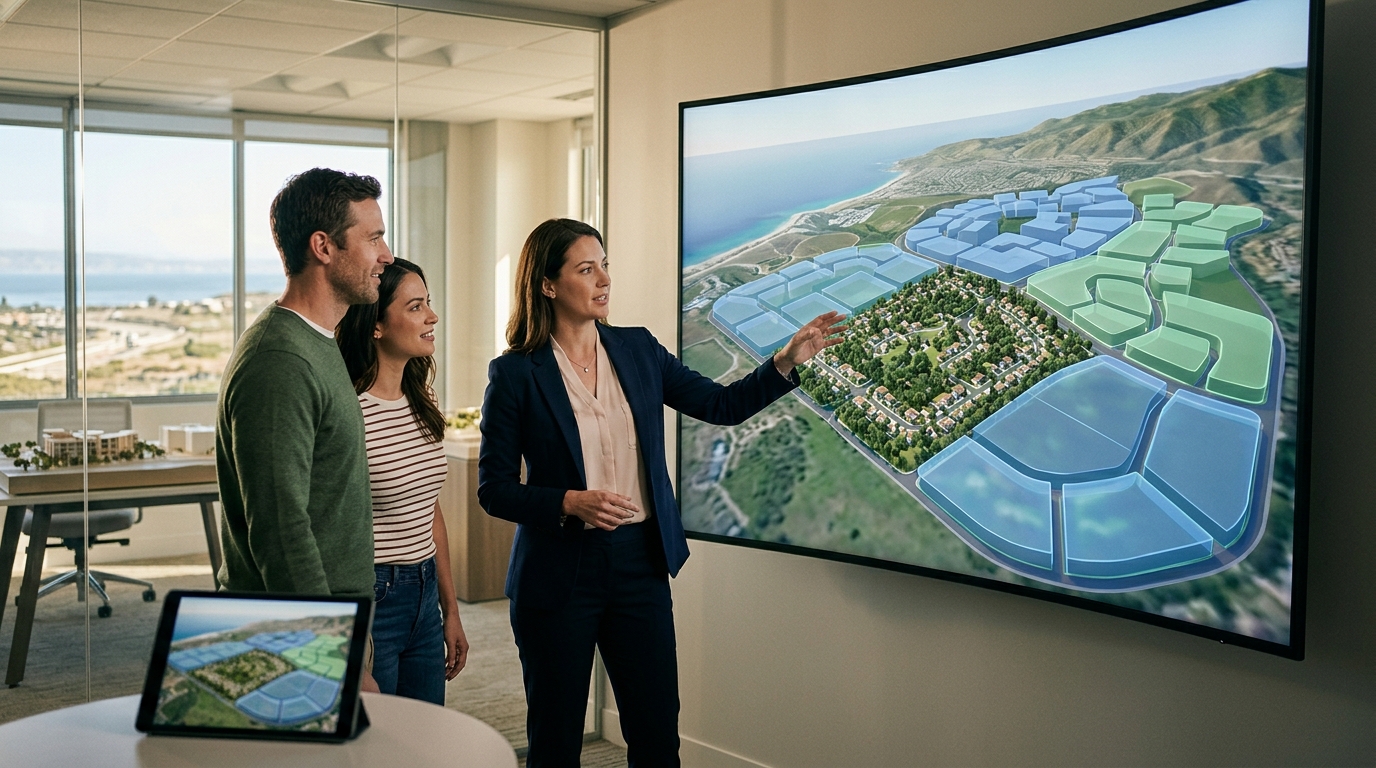
Presenting a multi-decade master-planned development to early-phase buyers requires a delicate balance between showcasing a grand future vision and maintaining absolute transparency about what exists today.
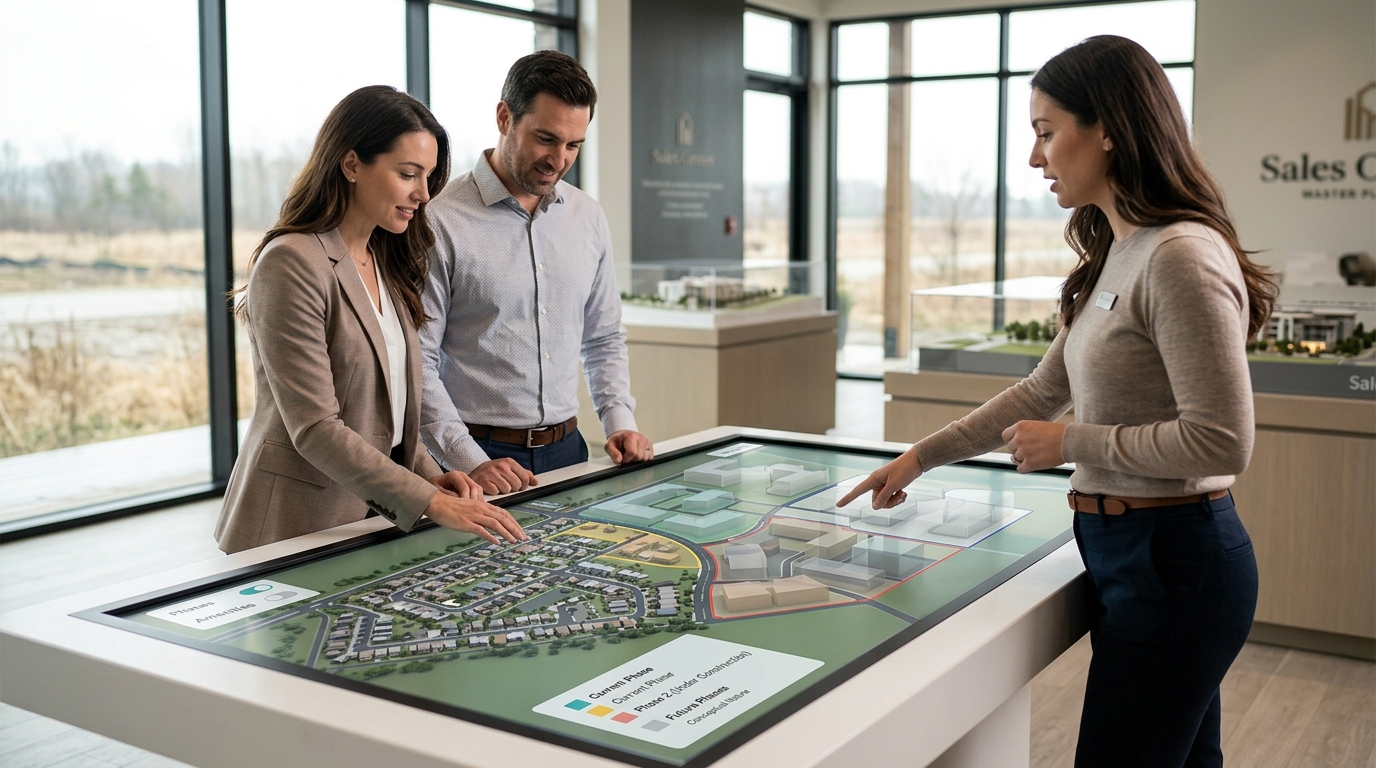
The Phasing Dilemma in Large-Scale Developments
Master-planned communities are long-term commitments, often spanning ten to twenty years from breaking ground to final completion. For developers, selling homes in Phase 1 requires conveying the value of Phase 4 amenities, such as school sites, retail centers, and parks, that may not exist for another decade. Buyers must purchase into a vision, but they also need to know exactly what they are paying for today.
When marketing materials blur the line between immediate reality and distant future possibilities, developers risk buyer dissatisfaction, negative reviews, and potential legal challenges. The challenge lies in presenting an exciting, cohesive vision of the completed neighborhood while clearly distinguishing what is built, what is under construction, and what is merely proposed.
Classifying Visual Elements: Current, Approved, and Illustrative
To prevent confusion, developers must establish a strict visual hierarchy across all marketing channels, especially on digital platforms. Visual elements should be categorized into three distinct tiers: current built environment, approved future phases, and illustrative or conceptual designs. Each tier requires a different visual treatment to signal its status to the buyer.
Current built environments are best represented with high-fidelity, verified imagery or live-rendered 3D geospatial data that matches the ground truth. Approved future phases, which have secured zoning and permits, can be shown with defined boundaries and realistic massing models. Illustrative elements, such as proposed commercial districts that lack final approvals, should be rendered as semi-transparent or stylized shapes to indicate their conceptual nature.
- Built Environment: Represented with actual photography, verified 3D models, or live geospatial data.
- Approved Phases: Shown with clear plot boundaries, realistic architectural massing, and estimated completion years.
- Conceptual Elements: Rendered as stylized, semi-transparent volumes to emphasize their illustrative status.
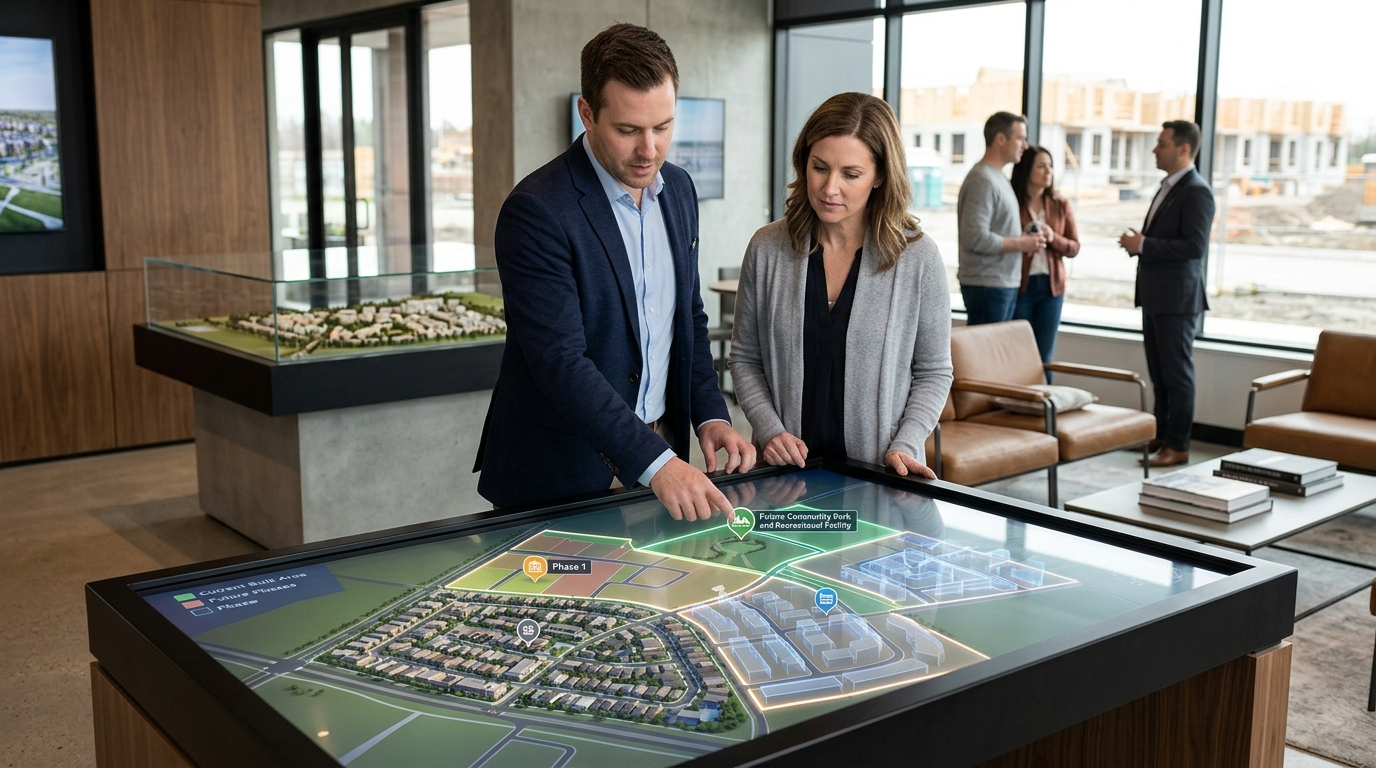
Mapping Evolving Infrastructure and Amenity Timelines
A common source of buyer frustration is the delay or relocation of key community amenities like clubhouses, pools, and parks. When buyers look at a static master plan, they often assume all featured amenities will be available when they move in. Developers must explicitly tie amenities to specific development phases and geographic locations.
Visualizing the physical routes and access points during different phases is equally critical. Early residents may have to use temporary construction roads or detour around active building sites. By showing how access routes, pedestrian paths, and green spaces evolve over time, developers can prepare buyers for the realities of living in an active construction zone while reassuring them of the ultimate layout.
This level of detail is difficult to convey with traditional flat maps or static PDF brochures. Interactive 3D maps allow users to adjust a slider or click through different phases, watching the roads, parks, and home sites appear in chronological order. This interactive exploration makes the timeline tangible and easy to comprehend.
The Limits of Physical Drone Footage for Future Phases
Drone photography and video have become standard tools for real estate marketing, offering stunning aerial perspectives of active developments. However, physical drone footage has significant limitations when applied to master-planned communities with multi-year timelines. A drone can only capture what exists in the present moment, leaving future phases as empty fields or dirt patches.
To show future phases, developers often overlay 2D graphics or 3D renders onto static drone photos. While visually appealing, these static composites quickly become obsolete as construction progresses, requiring expensive re-shoots and graphic updates. Furthermore, static overlays do not allow buyers to explore the surrounding geographic context or understand how the community connects to nearby highways, schools, and shopping centers.
Physical drone production also lacks interactivity. A pre-recorded video follows a single, rigid flight path, preventing prospective buyers from zooming in on their specific lot or exploring the neighborhood at their own pace. This is where interactive 3D geospatial visualization provides a more flexible, cost-effective, and compliant alternative.
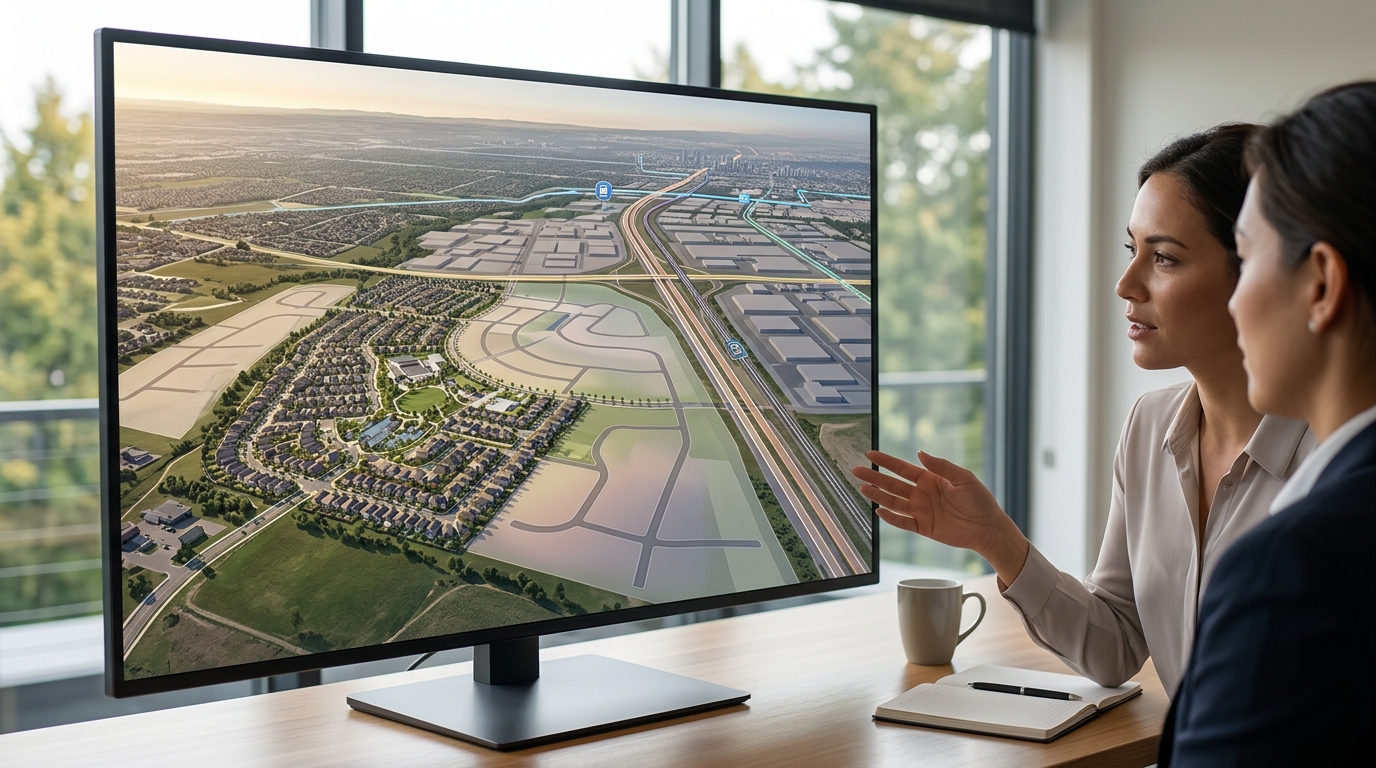
Using Interactive 3D Geospatial Storytelling for Clarity
Interactive 3D geospatial platforms, such as Georivo, offer a modern solution to the phasing communication challenge. By turning a property address and surrounding geographic data into an embeddable, photorealistic 3D location story, developers can guide buyers through the entire lifecycle of the community. These platforms combine licensed geospatial imagery with customizable overlays to create a living digital model of the development.
Sales teams can prepare the automatic location presentation to highlight the progression of phases. For example, a guided 3D tour can start with a wide aerial view of the entire region, zoom in on the active Phase 1 home sites, and then transition to a stylized view of the planned Phase 2 park and retail district. This structured storytelling ensures that buyers understand the physical relationship between different phases and the surrounding region.
After the programmed playback ends, buyers can engage in live exploration. They can rotate the map, zoom in on specific blocks, and view the neighborhood from different angles. This level of transparency builds confidence, as buyers can see exactly how close their potential home will be to future construction zones, transit routes, and green spaces.
Language and Disclaimers That Protect and Inform
Clear visuals must be paired with precise, easy-to-understand language. Legalese buried in the footer of a website is rarely read by buyers and does little to prevent misunderstandings. Instead, developers should integrate clear labels and brief explanatory notes directly into the interactive visual experience.
Avoid vague terms like coming soon without providing context or estimated ranges. Instead, use phrases like Anticipated Completion: Winter 2026 or Proposed Amenity: Subject to Final Municipal Approval. When describing infrastructure that depends on local government, such as public school construction or highway expansions, clearly state that these projects are outside the developer's direct control.
The goal of this language is not to discourage buyers, but to manage expectations realistically. When buyers feel that a developer is being completely honest about timelines and potential changes, they are more likely to trust the brand and recommend the community to others, reducing the risk of post-purchase remorse and disputes.
Maintaining an Updateable Source of Truth
A master-planned community is a dynamic project. Timelines shift, site plans are modified, and new amenities are approved. Keeping marketing materials updated across multiple physical sales centers, websites, and third-party listing portals is a constant challenge for marketing teams. Traditional print brochures and static video files make updates slow and expensive.
Utilizing a cloud-based 3D visualization platform solves this problem by creating a single, updateable source of truth. When a site plan changes or a new phase is released, the developer can update the digital 3D model in one central location. Because the interactive map is embedded via domain-bound links or shared through protected URLs, the updates instantly reflect across all active websites and sales center displays.
Best Practices for Sales Center Presentations
The physical sales center remains a crucial touchpoint for master-planned community buyers. Here, sales consultants have the opportunity to guide buyers through complex phasing plans face-to-face. Replacing static wall-mounted maps with interactive touchscreen displays running 3D location stories dramatically improves the quality of these conversations.
Sales consultants can use the interactive 3D map to address specific buyer concerns in real time. If a buyer is worried about construction noise, the consultant can show the exact distance between Phase 1 homes and the active Phase 2 construction boundary. If a buyer wants to know how their children will walk to the future school site, the consultant can trace the planned pedestrian paths on the 3D screen.
This interactive, personalized approach transforms the sales presentation from a generic pitch into a collaborative exploration. By providing clear, visual answers to difficult questions, sales teams can overcome objections faster, shorten the sales cycle, and ensure that buyers leave with a realistic, positive understanding of the community's future.
| Phase Category | Visual Representation | Certainty Level | Key Communication Objective |
|---|---|---|---|
| Active Construction | Full-color photorealistic 3D models and actual imagery | High (Currently building) | Show immediate availability and move-in readiness |
| Approved Future Phase | Detailed 3D massing with clear plot boundaries | Medium-High (Permits secured) | Highlight near-term growth and upcoming home options |
| Proposed Amenities | Stylized, semi-transparent 3D shapes | Medium (In planning) | Communicate long-term lifestyle value without guaranteeing exact designs |
| External Infrastructure | Contrasting color paths and regional markers | Variable (Third-party controlled) | Show regional connectivity and access routes clearly |
Step-by-Step Workflow for Phased Community Visualization
- Gather updated GIS site plans, zoning documents, and architectural massing models for all active and planned phases.
- Import the community coordinates into a 3D geospatial platform like Georivo to establish the real-world regional context.
- Apply distinct visual styles to differentiate completed homes, approved future phases, and conceptual amenity spaces.
- Program guided camera paths that walk buyers chronologically through the development timeline and surrounding neighborhood.
- Embed the interactive 3D location story on the community website and load it onto touchscreen displays in the sales center.
Transparency in master-planned marketing is not just about legal compliance; it is about building long-term trust with the pioneering buyers who fund your early phases.
FAQ
How do you show future phases without misleading buyers?
Use distinct visual styles for different phases, such as realistic 3D models for active construction and semi-transparent massing models for future phases, paired with clear timeline labels.
Why is physical drone footage insufficient for phased developments?
Drone footage only captures what exists today, leaving future phases as empty land, and cannot be easily updated as construction progresses without expensive re-shoots.
What is the best way to visualize community amenities that are not yet built?
Render them as stylized 3D shapes on an interactive map, clearly labeled with anticipated completion dates and notes indicating that designs are illustrative.
How can interactive 3D maps help manage buyer expectations regarding construction noise?
By showing the physical distance between active phases and future construction zones, allowing buyers to see exactly how development will progress relative to their lot.
How often should a master-planned community's 3D visualization be updated?
Updates should occur whenever a new phase is officially released, site plans are modified, or major infrastructure milestones are reached to maintain a single source of truth.
Can interactive 3D location stories be used on mobile devices for buyers on the go?
Yes, modern 3D geospatial platforms like Georivo are fully responsive, allowing buyers to explore the community layout and regional context on mobile browsers.